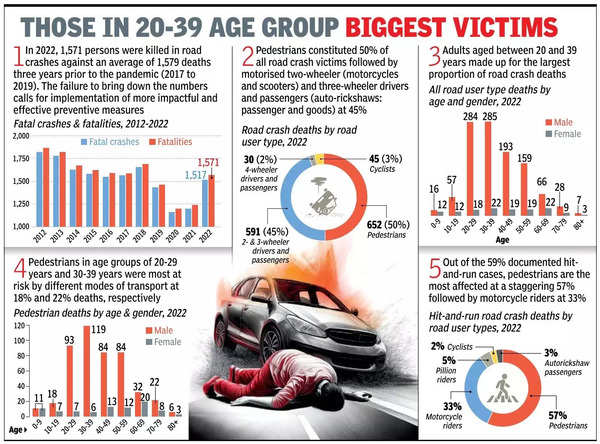
NEW DELHI: Pedestrians comprised half of the accident victims (50%) in Delhi, followed by motorised two-wheeler riders and three-wheeler occupants (45%), according to the 2022 Delhi Road Crash Fatalities Report.

The report also revealed that a staggering 98% of fatalities involved vulnerable road users in the city, which include pedestrians, cyclists, motorcyclists and three-wheeler occupants.This is higher than the national average of 70.8%.
The toll in road accidents in Delhi in 2022 was 1,571, nearly identical to the average number of fatalities (1,579) in the three years preceding the Covid pandemic (2017-2019). The report, finalised this month by Delhi govt’s transport department in collaboration with The Bloomberg Philanthropies Initiative for Global Road Safety and with the assistance of Vital Strategies and Transportation Research and Injury Prevention Centre, provides valuable insights into the state of road safety in the capital.
A govt official explained that despite the data pertaining to 2022, finalising the report took time because it also identifies fault lines and suggests steps to be taken to reduce road accidents. The data is considered comprehensive because the transport department creates a digitised dataset after receiving accident details from police, also ensuring changes, when necessary, such as when initial information is about serious injuries but later results in deaths.
July, August, October and December were the most dangerous months in 2022. Adults aged between 20 and 39 years made up the largest proportion of the deaths (50% of all road crash deaths). Males in the age groups of 20-29 and 30-39 comprised the majority of motorcycle fatalities, with respectively, 33% and 29% of the deaths.
Pedestrians aged 45 years and above were at a higher risk of getting killed in accidents compared with younger people. Female pedestrians above the age of 60 were more vulnerable compared with younger female walkers. Of the documented fatal crashes, 59% of them are hit-and-run cases and pedestrians were the most affected at 57% followed by motorcycle riders at 33%.
The “who hit whom” matrix shows that 55% of the impacting vehicles are unknown in the case of pedestrian fatalities, while 35% of these were three-wheelers and four-wheelers. In the case involving motorcyclists, 22% of the accidents were caused by heavy vehicles and 45% by unknown vehicles.
As a way forward, the report says there is a need for more walkable streets, safer pedestrian and cycling infrastructure, reduced speed limits, an enhanced rate of challan payment and enforcement on clasped motorcycle helmets and seatbelts with enhanced actions. The report also said steps necessary to make streets safer included breaking down the larger intersections into separate, smaller intersections with corresponding traffic signals installed for smoother movement of all road users. Continuous clear paths for walking, higher visibility for pedestrians and the introduction of safe and accessible refuge islands could provide pedestrians with a safe space.
A transport official said, “Evidence suggests that more footpaths, shorter pedestrian crossing distances on roads, raised crosswalks, frequency of public transport and reducing risks such as speeding, riding without a properly clasped helmet, drunk driving and failure to use seatbelts, can contribute to a reduction in fatal accidents.”
The official recalled that the previous year’s report had identified 20 high-risk corridors and 17 high-risk areas, where the transport department had intervened with the support of urban planners and street design experts with global experience.


